
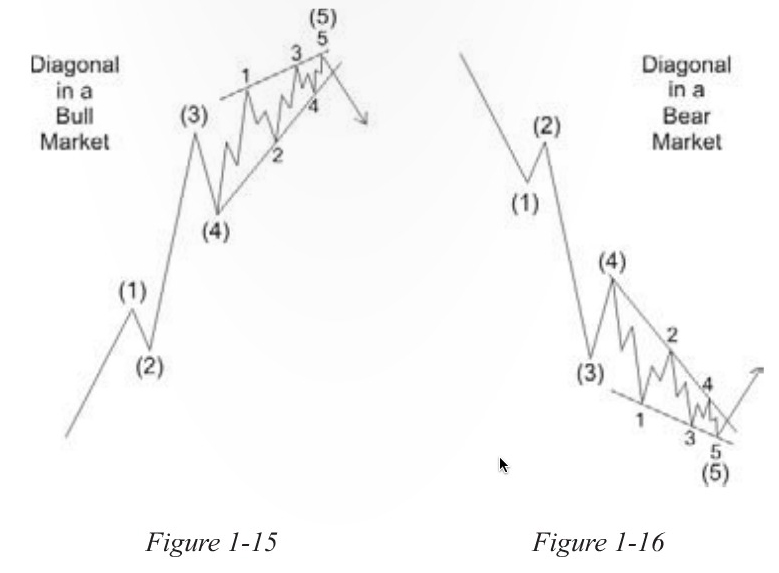
 An ending diagonal (also called a wedge in non-EW related patterns) is part of the triangle family. As such, it consists of 5 waves of 3 waves each, a 3-3-3-3-3 configuration.
It’s an ending wave and can be found at the end of a motive wave pattern, as a fifth wave, or at the end of a correction, as part of the C wave.
Although it’s not shown in the diagram to the left, it will often come back and finish off with a double top or bottom before it finally turns for good in the opposite direction. I’ve scanned a real example from page 38 of the Elliott Wave Principle, which you should purchase if you’re serious about learning and following the Elliott Wave method. This real chart example shows the double top on an ending diagonal after the diagonal pattern has finished.
Real World Study: EUR/USD
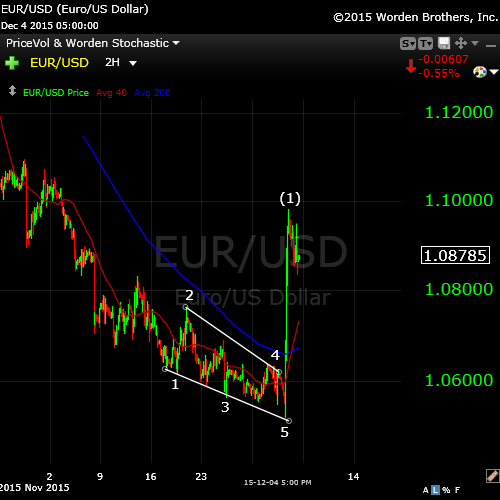
Above is a 2 hour chart of the ending diagonal on December 4, 2015 in the EUR/USD currency pair. Here you can easily see the ending diagonal pattern with its 5 waves (each one a 3 wave pattern). And ending diagonal many times finishes up with a “throw-over” (the final wave will drop below the ending trendline, or rise above in the case of a bull market).
Once the ending diagonal finishes the pattern, there is a dramatic thrust in the opposite direction which should quickly return to the start of the pattern, which was exactly what happened in this case.
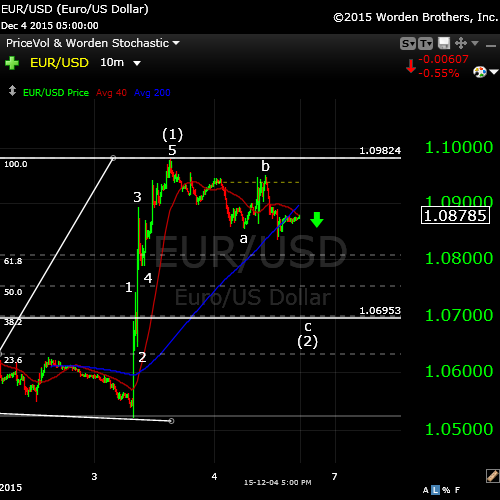
This is a 1o minute chart of the same event. Here you see the five waves up from the tail end of the diagonal. Five waves up sets a new trend (establishes a longer term move in the direction of the five waves).
Once 5 waves up are complete, the Elliott Wave Principle requires a 62% move in the opposite direction (wave 2). The lower horizontal line shows the target for the wave 2 move (in three waves, or an abc configuration). There is an alternative possibility, this being a first wave of a new trend. You’ll find the alternative move in the bottom chart on this page.
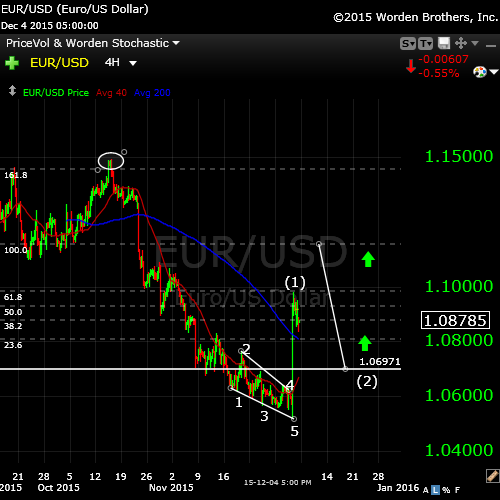
This final chart is a longer term 4 hour chart. Here you can see the entire ending diagonal pattern from the previous 4th wave (oval) to the bottom of the pattern itself. What I’m showing here is the third wave move that follows the second wave move of the previous chart above. The third wave will start at the target of the second wave move (the horizontal line) and extend up 1.618 times the length of the first wave, ending in this case at the previous fourth wave, or approximately.1.15. (or in the alternate case, it will start from the fourth wave—38%—and move up to 1.172).
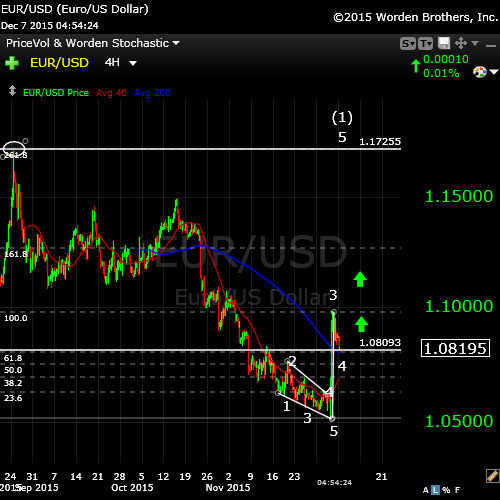
Alternative: I am also reminded that this is a first wave (in 5) and as a first wave, it may only retrace to the previous 4th before launching a 5th wave up, which would likely take it up to 1.172 before doing a 62% retrace.


